Information is power. In such a competitive world, information is an extremely important factor for companies in the most varied sectors of activity to be able to understand current consumer trends and thus make more assertive decisions in line with what the market is asking for.
Average ticket (average amount spent by a consumer on each purchase), payment methods most used, number of transactions, total turnover or performance by geographical area, are some of the most important pieces of information for company management and decision-making.
REDUNIQ Insights monthly sector infographic
However, for this to be possible there needs to be a tool that does the work of researching, collating and debugging market data and presenting it to companies in an understandable and intuitive way.
This tool is called REDUNIQ Insightssolution known to UNICRE - Instituição Financeira de Crédito, S.A. which, since 2020, has been providing analytical information to its clients, based on information from the retail sector in Portugal, thus helping companies to generate insights when making business development decisions, and which has now taken this mission even further with the launch of monthly sector infographicsThe new service is available at Customer Areafor €4.99 + VAT per month.
Designed and created to provide companies with closer and more personalised monitoring of their sector of activity, the sector infographics of the REDUNIQ Insights offers:
- specific information on each sector of activity;
- year-on-year comparison of the sector's performance with the market;
- the possibility for a given company to know its customers and where they come from.
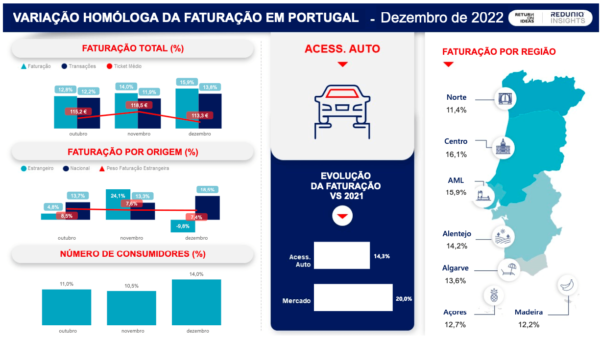
Take the car accessories sector, for example:

As you can see from this infographic on the auto accessories business for December last year, you can find out more:
- the number of consumers and their evolution over the last year;
- the sector's total turnover and its origin (domestic turnover and foreign turnover)
- invoicing broken down by region.
This infographic is just a small snapshot of what companies can find in this new monthly paid sector infographics. In addition, businesses can obtain:
- specific data for your sector of activity;
- year-on-year comparison of the sector's performance with the market;
- customised reports fully adapted to the needs of the company in question with complete flexibility in the analysis parameters which, among other things, allow a business to find out about the consumption profile and retention level of its customers or the comparative performance with the competition.
In specific terms, here's what businesses can find in the products launched by REDUNIQ Insights:
Monthly paid sector infographics
With the new monthly paid sector infographicsyou will have access to:
- Total Turnover, Transactions and Average Ticket;
- National and foreign invoicing;
- Number of consumers;
- Consumption performance by activity sector and geographical area.
- Specific data for each sector of activity;
- Year-on-year comparison of the sector's performance with the market;
- Analysing more sectors.
Based on detailed information on the consumption profiles carried out in establishments served by REDUNIQ's national and foreign card acceptance network, the largest in Portugal, a report will be produced that is fully adapted to your company's needs, with all the flexibility in the analysis that will allow you to monitor your business in depth over time.
By carrying out this analysis, the report allows you, as we mentioned, to find out about your customers' consumption profile and degree of retention, or their comparative performance with the competition.
As for the sectors currently available, there are 13, such as: Car Accessories and Workshops, Hairdressers, Electrical Appliances & Technology, Pharmacies, Petrol Stores, Hyper & Supers, Hospitality and Tourist Activities, Fashion, Stationery, Perfumery & Cosmetics, Catering, Traditional Food Retail and Health.


