Get to know your business better with REDUNIQ Insights
Turn data into strategic decisions. Access detailed analyses of your business's performance, learn more about your customers and their consumption habits - by sector, location and even in relation to the competition. All in one place.
- Do you know how many customers are loyal to your business?
- And how many of them also buy from competitors?
- Do you know your customers' country of origin?
- Are you keeping up with market trends? What about your competitors?
Choose the ideal solution for your business


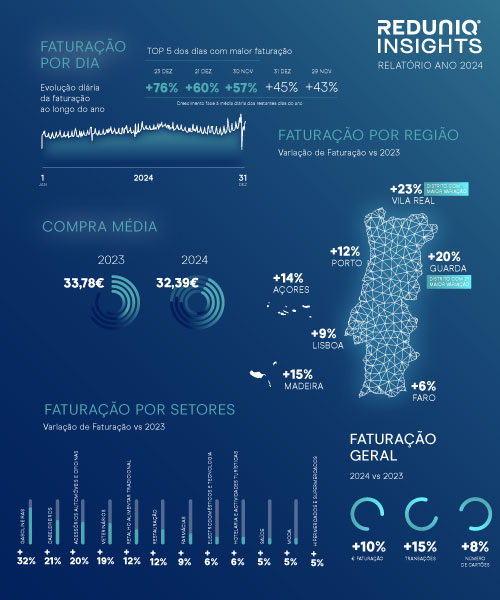
REDUNIQ Insights Report for the Year 2024.
REDUNIQ Insights Report for Christmas and New Year 2024.
REDUNIQ Insights report on transactional variation during Black Friday.
REDUNIQ Insights report on transactional variation during the summer.
REDUNIQ Insights report on the transactional variation during Easter.
REDUNIQ Insights report on the transactional change in business in 2023
REDUNIQ Insights report on the transactional variation of business over Christmas and New Year's 2023
REDUNIQ Insights report on the transactional change in business on Black Friday, compared to 2022
REDUNIQ Insights report on the transactional variation of business during 2023.
REDUNIQ Insights report on the transactional variation of business during the first half of 2023.
REDUNIQ Insights report on the transactional variation of business during 2022.
REDUNIQ Insights report on the transactional variation of businesses on Black Friday, compared to 2021
REDUNIQ Insights report on the transactional variation of business during the summer of 2022.
REDUNIQ Insights report on the transactional variation of business during the first half of 2022.
REDUNIQ Insights report on the transactional variation of business during 2021.
REDUNIQ Insights report on the transactional variation of business over the Christmas and New Year period, compared to pre-pandemic data.
REDUNIQ Insights report on the transactional variation of businesses on Black Friday, compared to pre-pandemic data.
REDUNIQ Insights report on the transactional variation in business this summer, with an emphasis on the tourism sector.
REDUNIQ Insights report on the impact of deconfinement on consumption, one year on.
REDUNIQ Insights Report on the 2nd General Confinement.
REDUNIQ Insights Report for 2020 and the 2nd General Lockdown enacted on 13 January 2021.
REDUNIQ Insights report on the State of Emergency period. 29 November to 12 December 2020.
REDUNIQ Insights report on the State of Emergency period. 15 to 28 November 2020.
REDUNIQ Insights report on the State of Emergency period. 1 to 14 November 2020.
REDUNIQ Insights report for summer 2020. Analysis up to 26 September 2020.
REDUNIQ Insights report on the period of deconfinement and first reopenings after the State of Emergency. 12 to 18 July 2020.
REDUNIQ Insights report on the period of deconfinement and reopenings after the State of Emergency. 14 to 20 June 2020.
REDUNIQ Insights report on the period of deconfinement and reopenings after the State of Emergency. 31 May to 6 June 2020.
REDUNIQ Insights Report on the period of deconfinement and first reopenings after the State of Emergency. 24 to 30 May 2020.
REDUNIQ Report Insights from the period of deconfinement. The shape of the crisis and the recovery. 17 to 23 May 2020.
REDUNIQ Insights report on the period of deconfinement and first reopenings after the State of Emergency. 10 to 16 May 2020.
REDUNIQ Insights report on the period of deconfinement and first reopenings after the State of Emergency. 3 to 9 May 2020.